
Data Analysis & Visualization Projects
🌪️ Tornado Interactive Dashboard
🔗 GitHub Repo 🚀 Live App
Description
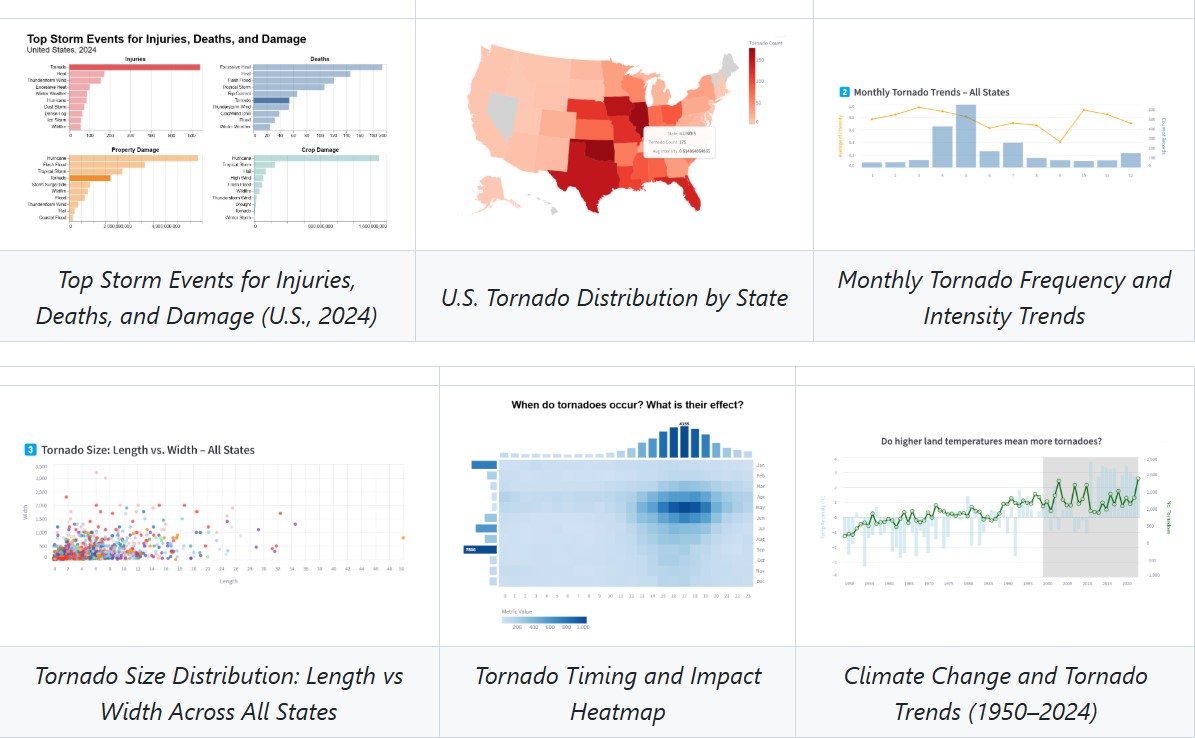
This interactive dashboard provides a comprehensive view of tornado activity across the United States using historical NOAA data.
Users can explore patterns in tornado frequency, severity, and damage metrics through customizable visualizations.
- Developed using Altair for rich interactivity and responsive layout
- Supports filtering by state, year, and Fujita scale (EF0–EF5)
- Visualizes fatalities, injuries, and property/crop damage through charts and heatmaps
- Enables analysis of temporal trends and geospatial distribution
📊 Interactive Visualization of School Demographics and Performance
Description
This project explores the complex relationships among school demographics, economic status, and academic performance in New York State through rich, interactive Altair visualizations.
By replacing static charts with responsive visual analytics, it allows users to investigate how factors like free lunch eligibility, race composition, school size, and gender distributions shape educational outcomes.
- Scatter + Bar Chart Combo: Visualizes how Financial Status relates to Score, with linked Race Composition charts
- Interactive Map + Gender Pyramid: Explores geographic patterns and gender structure in school populations across NYC
- Supports real-time filtering by school size, racial majority, and white-student ratio
- Designed for educational researchers and policy analysts to gain intuitive insights from large public datasets
💰 Health Insurance Cost Prediction
Description
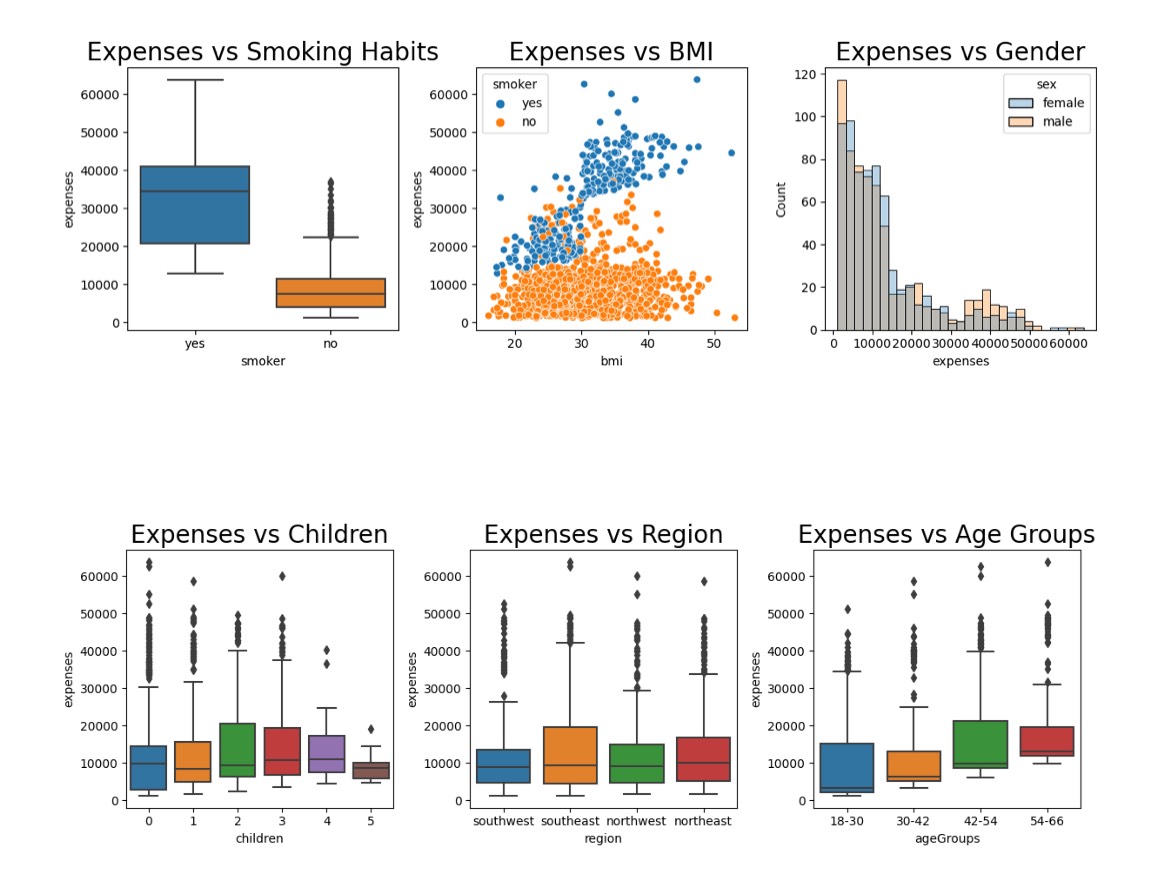
This project analyzes how factors like Age, BMI, Smoking status, and # of children influence Insurance Premium.
By applying machine learning techniques, it builds predictive models to estimate costs and highlight key drivers behind premium differences.
- Performed feature engineering to handle categorical and numerical variables, including Box-Cox transformations for normalizing skewed data
- Applied multiple regression methods, such as Linear Regression, Polynomial Regression, and Random Forest, to model insurance costs
- Conducted residual analysis to evaluate model fit and identify potential outliers
- Aims to support better understanding of pricing mechanisms and cost drivers in health insurance